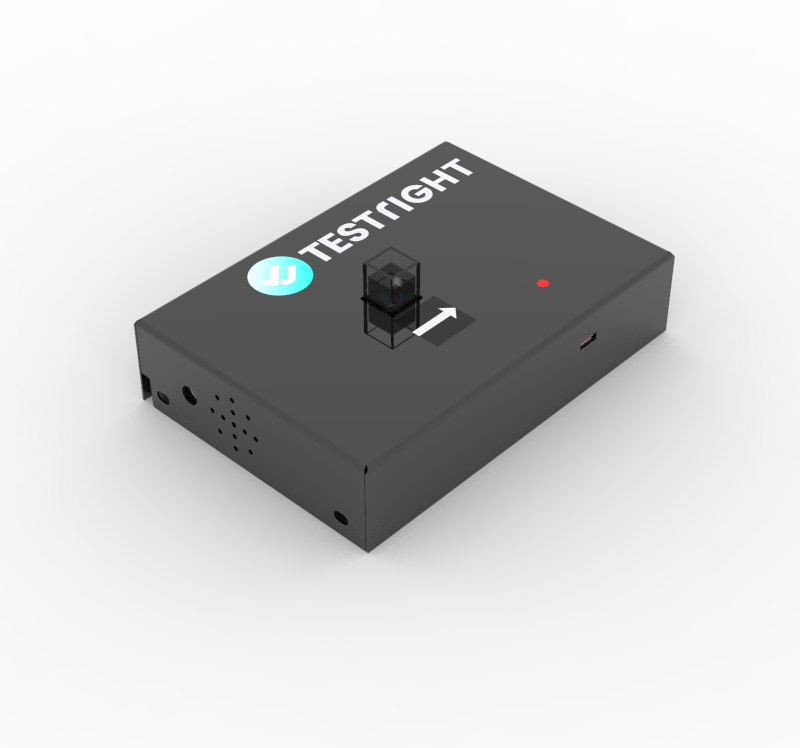
Portable UV-Vis Spectrophotometer compatible with Liquid/Solid/Thin-film samples. Upgradable to fluorescence and dip probe for continuous monitoring
TestRight’s indigenously produced spectrometers are excellent for conducting experiments at school, university and research level. And this is demonstrated by the observed data, obtained during the study of emission peaks of different light sources using TestRight’s spectrometers.
Aim
Study of emission peaks of different light sources using TestRight’s spectrometers.
EQUIPMENT REQUIRED
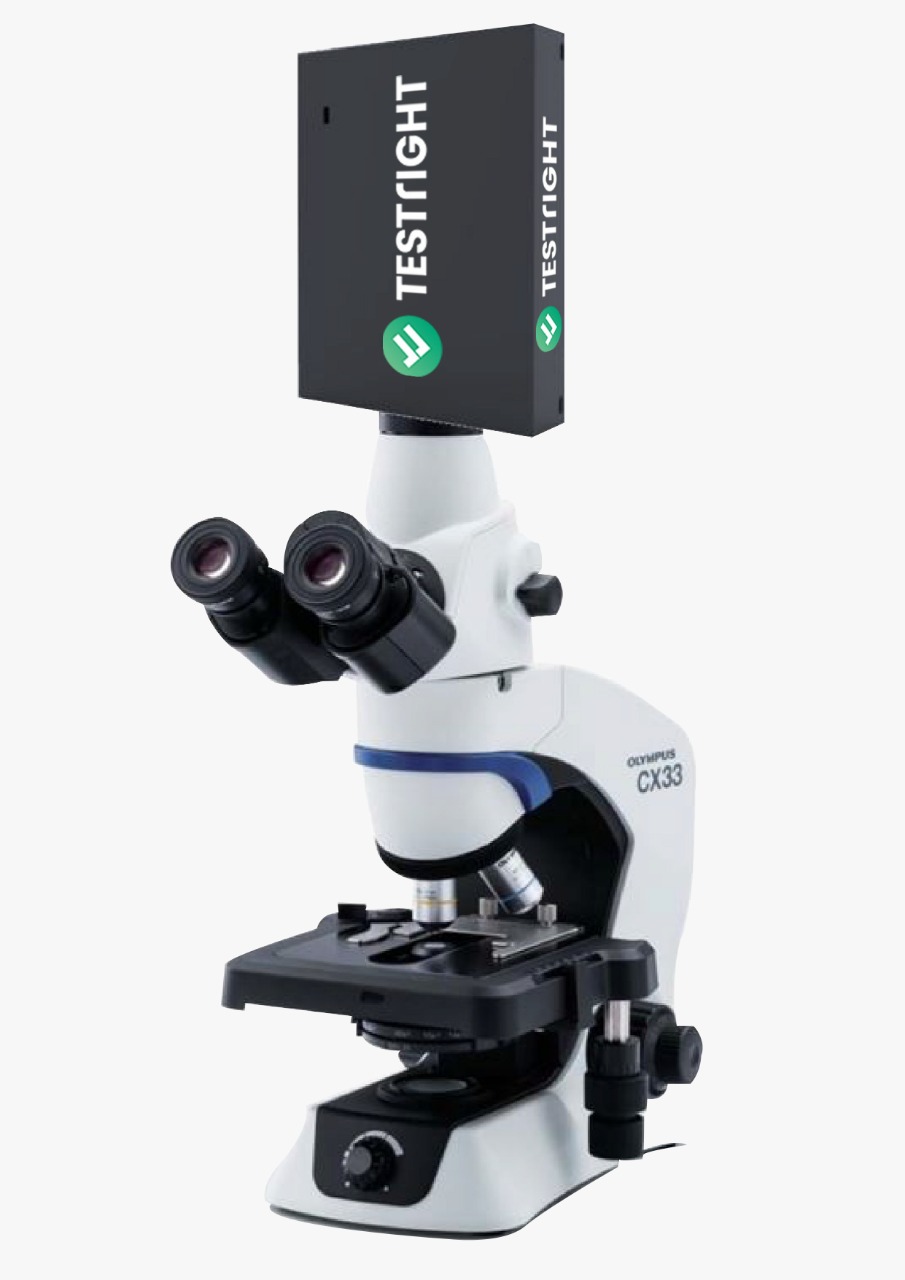
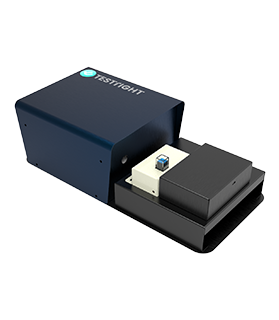
Light sources of interest, TestRight’s spectrometer, USB cable, and Laptop(for display).
Background
Spectrometers are frequently used in the technique of spectroscopy to measure light intensity in the UV, VIS, NIR, and IR regions. Spectroscopic measurements are being used in many different applications, such as color measurement, concentration determination of chemical components, or electromagnetic radiation analysis to name just a few. And thanks to the development of microelectronics; multielement optical detectors, such as the CCD array has enabled the production of compact and durable TestRight’s PRIZM spectrometers that allow fast scanning of the spectrum, without the need for a moving grating.
PROCEDURE
To conduct the experiment, proper device installation and functioning are necessary. First, the device is connected to the PC with the help of a USB cable provided along with the spectrometer. And once the device is powered up, it should be given a warm-up time of 15 minutes which is necessary for consistent results. And finally, after setting up the reference, various readings and spectra can be obtained as per the needs of our experiment.
OBSERVATION
The following observations were made from various light sources using TestRight’s spectrometer
1) Halogen light source
- In a quartz halogen lamp, a tungsten filament is sealed in a compact transparent quartz inner envelope filled with inert gas and a small amount of a halogen such as iodine or bromine.
- Quartz halogen lamps make use of a chemical reaction called the halogen cycle to redeposit the tungsten back onto the filament.
- This allows the lamp to operate at a higher temperature and yields a longer service life.
- The emission spectra of the measured quartz halogen lamps are as shown in Fig. 1. It is also possible for a quartz halogen lamp spectrum to exhibit a series of shallow absorptions, sometimes.
- These are likely due to the trace of an element present in the glass used in the bulb.
2) Mercury light source
- It is a high-intensity discharge lamp that uses an electric arc to excite mercury to produce light.
- In contrast to fluorescent lamps, the arc discharge is confined to a small fused quartz tube mounted within a larger borosilicate glass bulb that absorbs the UV emissions and fluoresces, producing more light in the visible range.
- A single mercury vapor lamp was measured and the spectra were obtained as shown in Fig. 2.
- The lamp produces a substantial quantity of heat and its spectrum bears some resemblance to an incandescent lamp.
3) CFL source
- Spectra were also acquired for compact fluorescent lamps. The fluorescent lamp is a low pressure gas discharge lamp that generates light predominately by phosphors excited by UV emissions.
- The glass tube is filled with a mixture of low-pressure mercury vapor and inert gases such as argon, xenon, neon, or krypton.
- Electrons in the vapor are excited by an electric arc to produce a combination of visible and ultraviolet (UV) emissions.
- The primary mercury emissions in the ultraviolet are non-visual but can damage the eyes.
- To redistribute the UV emitted radiation into the visible, the inner surface of the glass tube is coated with a fluorescent coating made of metallic and rare-earth phosphor salts.
- The CFL lamp spectra consist of a set of sharp emission peaks as shown in Fig.3.
4) Sodium light source
- These lamps contain a sodium-mercury amalgam and trace quantities of inert gas, such as xenon, to assist in the startup.
- An electric arc passing through the chamber excites the electrons on the sodium and mercury atoms, causing them to glow.
- These lamps produce a characteristic golden-orange light. Spectra were measured for the sodium lamp. The strongest emission peak was observed at 655.842nm as shown in Fig. 4
5) LED source
- Spectra were also acquired from LED lamps. They are solid-state light sources that generate light by electroluminescence, moving electrons from a high energy state to a lower energy state on a semiconductor substrate.
- Measurements can be taken for a variety of LEDs with appearances ranging from white to blue, green, orange, and red. Fig. 5 shows the spectra for white LED lights featuring the primary emission at 450–460 nm.
- The LED spectra are generally typified by relatively narrow emission bands and virtually no NIR emission.

Conclusion
We found that TestRight’s indigenous spectrometer is an indispensable tool for our spectroscopic needs, as it accurately identifies lighting types, their efficiency, and quality using spectral data.